Description
Curriculum
Instructor
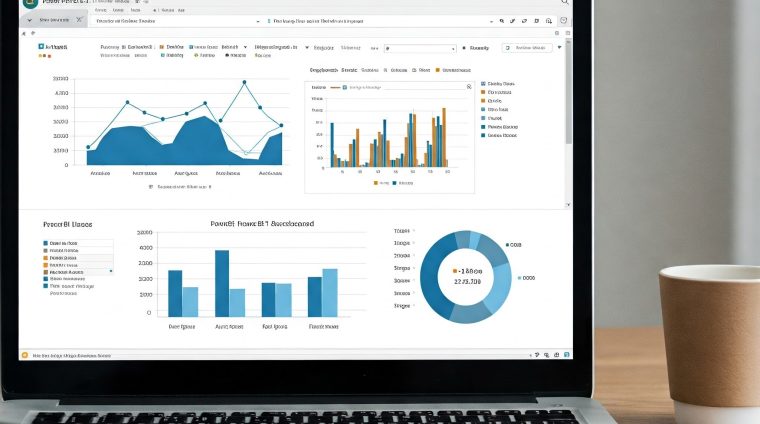
This comprehensive course is designed to equip professionals with data visualization, reporting, and analytics skills using Power BI and Excel. Participants will learn how to transform raw data into meaningful insights, automate reports, and optimize business decision-making. With practical hands-on exercises, this course is ideal for data analysts, finance professionals, and business leaders looking to enhance their analytical capabilities.
Review

Free
4000 students
102 lessons
Language: English
9 quizzes
Assessments: Yes
Skill level All levels
Courses you might be interested in
This comprehensive course covers inventory control, stock management, and supply chain optimization. Students will learn strategies for minimizing costs, improving efficiency, and ensuring smooth business operations. With hands-on case studies,...
-
102 Lessons
Free
A specialized course covering workplace safety regulations, risk assessment, and environmental health practices. It provides professionals with the knowledge needed to create a safe working environment and ensure compliance with...
-
102 Lessons
Free
This course provides a structured approach to improving business processes, quality control, and operational efficiency. It emphasizes workflow optimization, project management, and organizational effectiveness. Ideal for business leaders and managers,...
-
102 Lessons
Free
Designed for aspiring data professionals, this course covers data visualization, statistical analysis, and real-world business applications. Students will learn to collect, process, and interpret data, transforming it into actionable insights...
-
102 Lessons
Free


